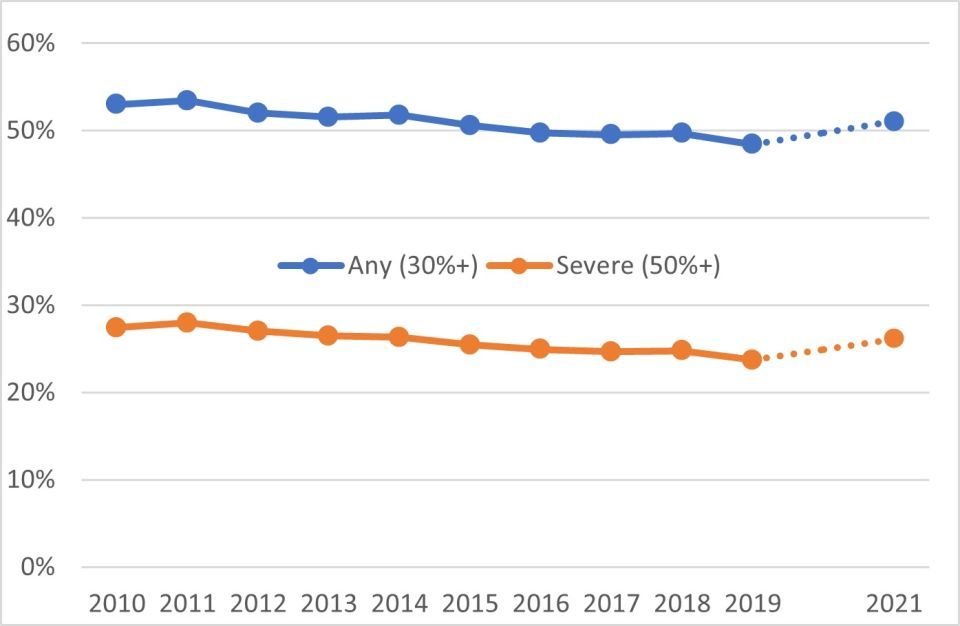
Throughout the 2010s, the share of renters who were cost burdened – as measured by the share of renter households spending at least 30 percent of their income on their combined housing and utility costs – has steadily, if slowly, declined.
New data from the Census Bureau shows that trend reversed in 2021, however, as the share with cost burdens rose to 51.1 percent (up from 48.4 percent in 2019).
This marks the first time since 2015 that more than half of all renter households have reported struggling to pay their housing costs.
The share of renters with severe cost burdens – defined as spending at least 50 percent of income on housing – exhibited a similar trend, rising to 26 percent after declining over the prior decade (see Figure 1).

The new data on cost burdened renters comes from Thursday's release of tabular data from the U.S. Census Bureau’s 2021 American Community Survey(ACS), which is the largest annual survey of people and households conducted by the federal government. It also comes after a pause in the survey in 2020 due to challenges with data collection during the early months of the Covid-19 pandemic. The new data is thus the first opportunity in two years to observe the nation’s 44.1 million renter households (as of last April when the survey was fielded) as they contended with the continued economic uncertainty stemming from the pandemic’s changes in income and housing costs.
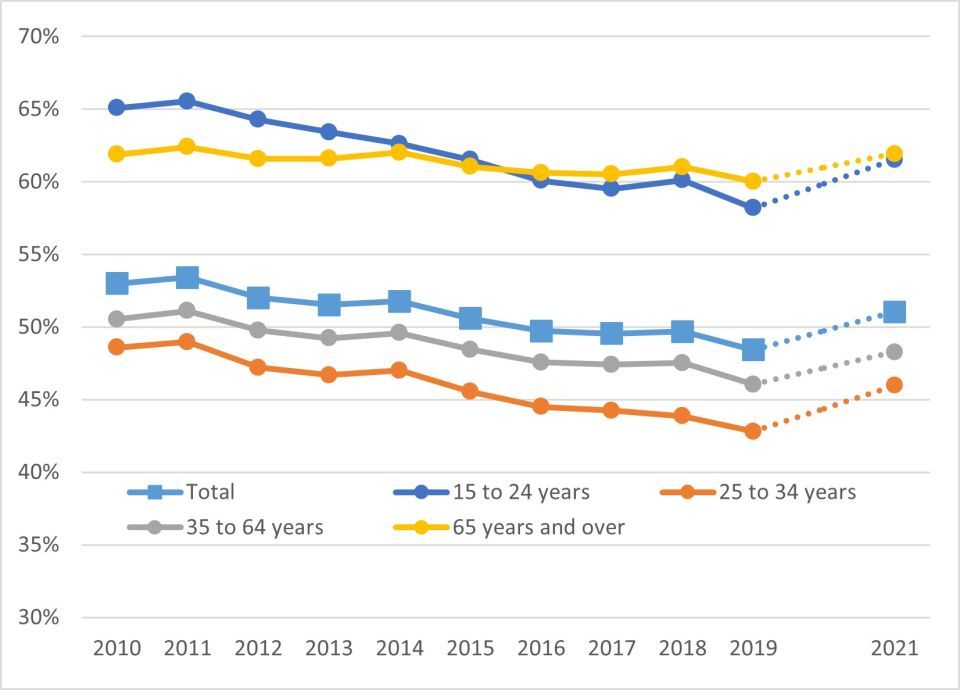
Beyond the top-line findings about the share of renters spending large shares of their income on housing, the new data also reveal how rental affordability varies across different household subsets, specifically by age and income. Similar to the trend in overall renter affordability, the share of cost-burdened of renters has declined over the prior decade in each age category specified in the tabular ACS data. The largest declines were observed among younger renters (ages 15-24 and 25-34), whose shares declined by 6 percentage points. Senior renters (ages 65 and over), meanwhile, had only modest declines in their cost-burden share and surpassed the youngest age group as the subset with the highest rate of households spending at least 30 percent of their income on housing.
The new data, however, reveal higher affordability challenges among all age groups, with the most dramatic increases observed among younger renters. Those ages 15-24 and 25-34 both saw their share of cost-burdened renters increase by over 3 percentage points between 2019 and 2021, a marked reversal of their steady declines over the prior decade. Renters ages 35 and over saw smaller growth in this metric, though seniors remain the most cost-burdened age group, with more than 61 percent spending at least 30 percent of their income on housing (see Figure 2).

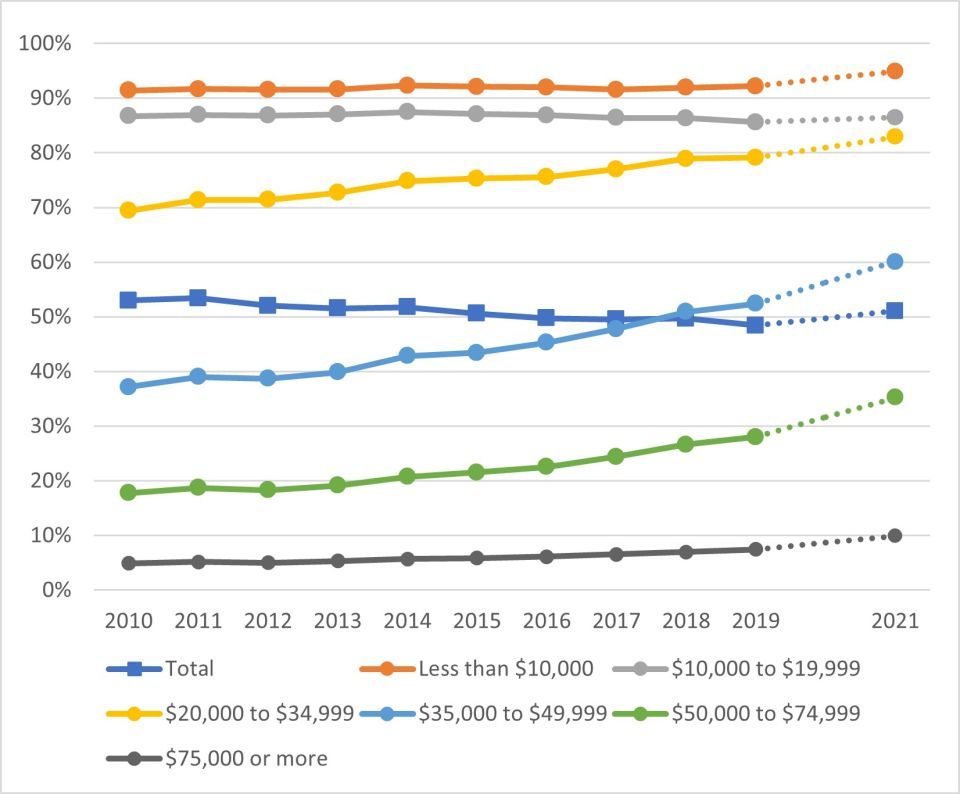
By income, a different set of long-term trends is visible, with the those at the low end (earning under $20,000 a year) seeing a fairly steady share of cost-burdened renters, while those with more moderate incomes experienced notable increases over the prior decade. The largest growth was among renters earning between $35,000 and $50,000, whose cost-burden share rose by 15 percentage points over nine years. Those in the $20,000-$35,000 and $50,000-$75,000 income ranges also saw their shares increase by double-digits. This deviation from the overall trend can be partially explained by the movement of households within the preset income bands reported by the tabular ACS data, which do not adjust for inflation over time. Yet it is also the case that low- and moderately-priced rentals have been disappearing from the housing stock in recent years, placing greater strain on moderate-income budgets to comfortably afford higher rents.
The data released today show a continuation of this trend, with some particularly dramatic increases among moderate-income renters. For example, more than 60 percent of households earning between $35,000 and $50,000 now report spending large shares of their income on housing, which is an increase of 8 percentage points since 2019 and 21 percentage points over the last decade. Those with incomes between $50,000 and $75,000 also saw their share of cost-burdened renters rise considerably, by over 7 percentage points in just two years, representing a near-doubling of that share since 2010. Even those earning $75,000 or more had notable gains, up 2.4 percentage points, such that one-in-ten renters in this income range is now spending at least 30 percent of their income on housing, up from one-in-twenty ten years ago.

It is worth noting that Census Bureau has not yet released public-use microdata (PUMS) from the ACS, which limits our options for analyzing this new data to only pre-published tables that Census has made available. It also means this analysis is based on Census’ methodologies for calculating the number and share of renters that are cost burdened, including the treatment of renters that report zero or negative rents or incomes, which differs slightly from our prior analyses of renter affordability trends. The PUMS data is due to be released later this fall, at which point we will be able to take a deeper look at these trends, including analyses of differences in cost burdens by race and ethnicity.
Stay tuned to the Enterprise Community Partners’ blog for additional insight on housing markets and our work to make home and community a place of pride, power and belonging. You can also subscribe to Enterprise’s daily newsletter, Today in Housing, for the latest on housing policy and research.
