Last week, the U.S. Census Bureau released county-level estimates of housing unit counts for 2020, which suggested there were 140.8 million dwellings in the country as of last July 1. While distinct from the 2020 Decennial Census count, this estimate allows the first glimpse at how changes in housing units over the last decade compare with those of the past.
Relative to the count of housing units in the 2010 Decennial Census (131.7 million), the net number of housing units – i.e. the combination of new units created minus any units removed from the stock – increased by only 6.9 percent in ten years. This rate of growth is not only half that of changes in housing units during the 2000s, but the lowest rate of net housing growth of any decade since such counts were first collected in 1940. The net growth in housing units even lagged the modest increase in the total population last decade, adding stress to an already tight housing market and placing upward pressure on rents and house prices.
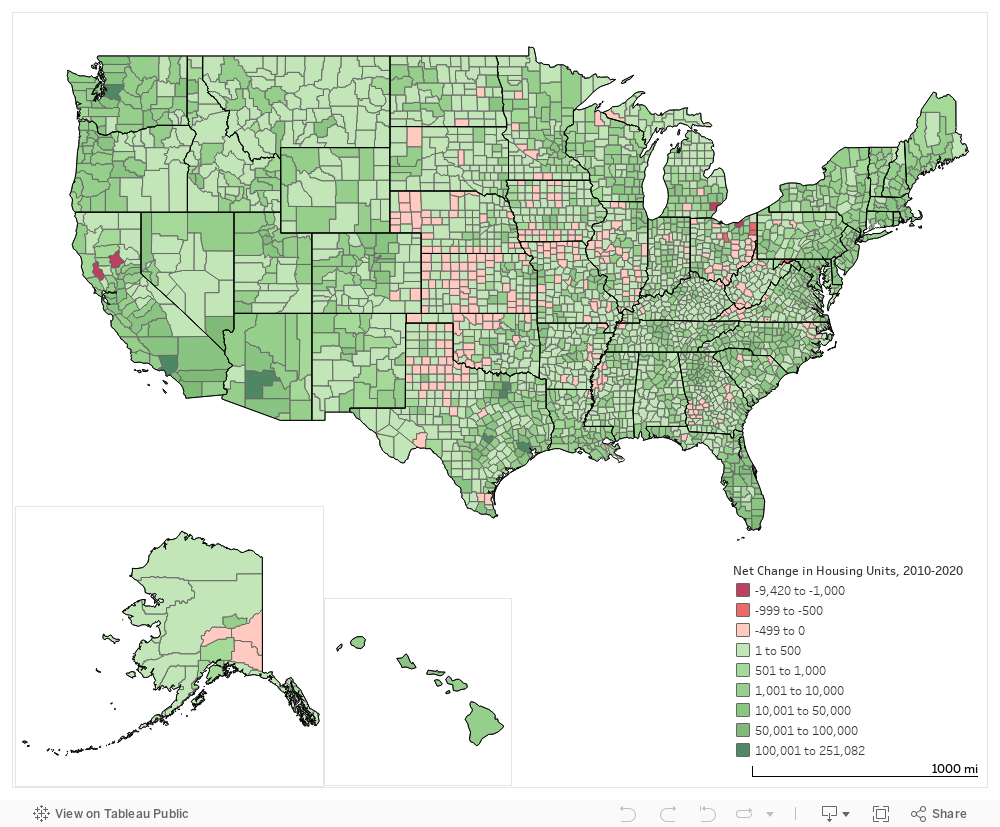
These broad national statistics, however, obscure the range of housing changes occurring across the country, with some places experiencing dramatic increases while others saw net declines in total housing stock. The interactive map below reveals the geographic distribution of this change, while the rest of this post focuses on the top gainers and losers of housing units over the last decade
Where Housing Supply Is Increasing
The counties with the largest net gains in housing were generally found at the center of large metro areas in the South and West, including the core counties of Houston, Phoenix, Los Angeles, Seattle, and Austin metros. Several of these counties were also among the top by population growth; Maricopa county, AZ and Harris county, TX were the top two in both measures, though third-place Los Angeles county, CA actually gained more housing than net new residents over the decade. Several large suburban counties outside of major cities also experienced net growth in housing units, including Collin and Tarrant counties outside of Dallas, TX.
Top 10 Counties by Net Increase in Housing Units, 2010-2020
|
County |
State |
Housing Units, 2010 |
Housing Units, 2020 |
Net Change in Housing Units, 2010-2020 |
Net Change in Population, 2010-2020 |
Metro Area |
|
Harris County |
Texas |
1,601,832 |
1,852,914 |
251,082 |
630,711 |
Houston, TX |
|
Maricopa County |
Arizona |
1,642,274 |
1,817,097 |
174,823 |
753,898 |
Phoenix, AZ |
|
Los Angeles County |
California |
3,446,768 |
3,599,420 |
152,652 |
121,399 |
Los Angeles, CA |
|
King County |
Washington |
851,966 |
987,044 |
135,078 |
335,884 |
Seattle, WA |
|
Travis County |
Texas |
442,391 |
565,804 |
123,413 |
270,111 |
Austin, TX |
|
Dallas County |
Texas |
944,029 |
1,055,499 |
111,470 |
262,177 |
Dallas, TX |
|
Collin County |
Texas |
301,297 |
402,884 |
101,587 |
284,967 |
Dallas, TX |
|
Clark County |
Nevada |
841,673 |
938,258 |
96,585 |
363,323 |
Las Vegas, NV |
|
Tarrant County |
Texas |
716,843 |
808,074 |
91,231 |
305,180 |
Dallas, TX |
|
Wake County |
North Carolina |
372,721 |
462,507 |
89,786 |
225,396 |
Raleigh, NC |
The net growth in housing in these counties comes despite lower rates of new construction over the last decade. Permits issued for new single-family housing from 2010 through 2019 were lower relative to the prior ten years in all these counties, and the number of total housing units authorized was down in six of them.
Where Housing Supply is Decreasing
On the other side of the spectrum, more than one in every ten counties had a net loss of housing units during the 2010s. Two of the top five in this category are Lake and Butte counties in California, where a series of devastating wildfires occurred late in the decade from which local communities have not yet had a chance to rebuild. The other counties in the top five, however, include the core counties of metro areas that have experienced several decades of population decline: Detroit, Cleveland, and Baltimore. Rounding out the top ten are five more counties associated with smaller metros in Ohio, Maryland and Virginia.
Top 10 Counties by Net Decrease in Housing Units, 2010-2020
|
County |
State |
Housing Units, 2010 |
Housing Units, 2020 |
Net Change in Housing Units, 2010-2020 |
Net Change in Population, 2010-2020 |
Metro Area |
|
Butte County |
California |
95,931 |
86,511 |
(9,420) |
(7,207) |
Chico, CA |
|
Wayne County |
Michigan |
820,882 |
815,330 |
(5,552) |
(74,224) |
Detroit, MI |
|
Cuyahoga County |
Ohio |
621,555 |
616,725 |
(4,830) |
(50,220) |
Cleveland, OH |
|
Baltimore city |
Maryland |
296,412 |
293,137 |
(3,275) |
(34,811) |
Baltimore, MD |
|
Lake County |
California |
35,522 |
34,470 |
(1,052) |
(257) |
Clearlake, CA |
|
Mahoning County |
Ohio |
111,800 |
111,172 |
(628) |
(12,240) |
Youngstown, OH |
|
Allegany County |
Maryland |
33,292 |
32,678 |
(614) |
(4,911) |
Cumberland, MD |
|
Danville city |
Virginia |
22,432 |
21,859 |
(573) |
(3,056) |
Danville, VA |
|
Trumbull County |
Ohio |
96,137 |
95,566 |
(571) |
(13,038) |
Youngstown, OH |
|
Richland County |
Ohio |
54,586 |
54,041 |
(545) |
(3,265) |
Mansfield, OH |
Absent a natural disaster, large net losses of housing units over time are not actually that common. That the largest counties in Detroit, Cleveland, and Baltimore all lost more than one out of every 150 housing units over a ten-year period reflects both a recognition that these places are unlikely to recover their lost populations in the near future, as well as a concerted effort to remove abandoned and blighted housing and put that land to better use.
Some city and county governments have formed land banks to take ownership of these challenging parcels and find alternative uses for them, including as community gardens or side yards to existing properties. In communities prone to flooding, removal of housing units can also be part of a managed retreat strategy, which turns vacant lots into stormwater buffers that protect homes further inland.
The Future of Housing Supply
While the total growth in housing units over the 2010s was low relative to historical rates, there are indications that a rebound may be on tap for the current decade. For one, the annual rate of housing unit growth increased in each year from 2010 to 2020, from 0.37 percent in 2010-11 to 0.88 percent in 2019-2020, as the construction industry gradually recovered from the late-2000s housing market bust.
For another, a growing acknowledgement of the consequences of an undersupply of housing nationally has developers, advocates, and policymakers all working on solutions to incentivize new construction. High costs for land, labor and materials remain a significant barrier to realizing any large-scale construction programs to address the urgent need for housing.
Ramping up the development of new housing is especially critical for ensuring that safe, quality, and affordable housing is available for the millions of low-income families that need it. Whether as purpose-built new construction or filtered down housing freed up by new market-rate units, expanding the supply of affordable housing – particularly in high-opportunity communities – will be vital to the long-term health and well-being of all communities and their residents.
Subscribe to our daily Today In Housing newsletter and visit the Enterprise Blog for more information on how Enterprise is working to make home and community places of pride, power and belonging, and platforms for resilience and upward mobility for all.